Basic Dashboard Template for Google Sheets
Download the Sample Basic Dashboard Template for Google Sheets
Download the Blank Basic Dashboard Template for Google Sheets
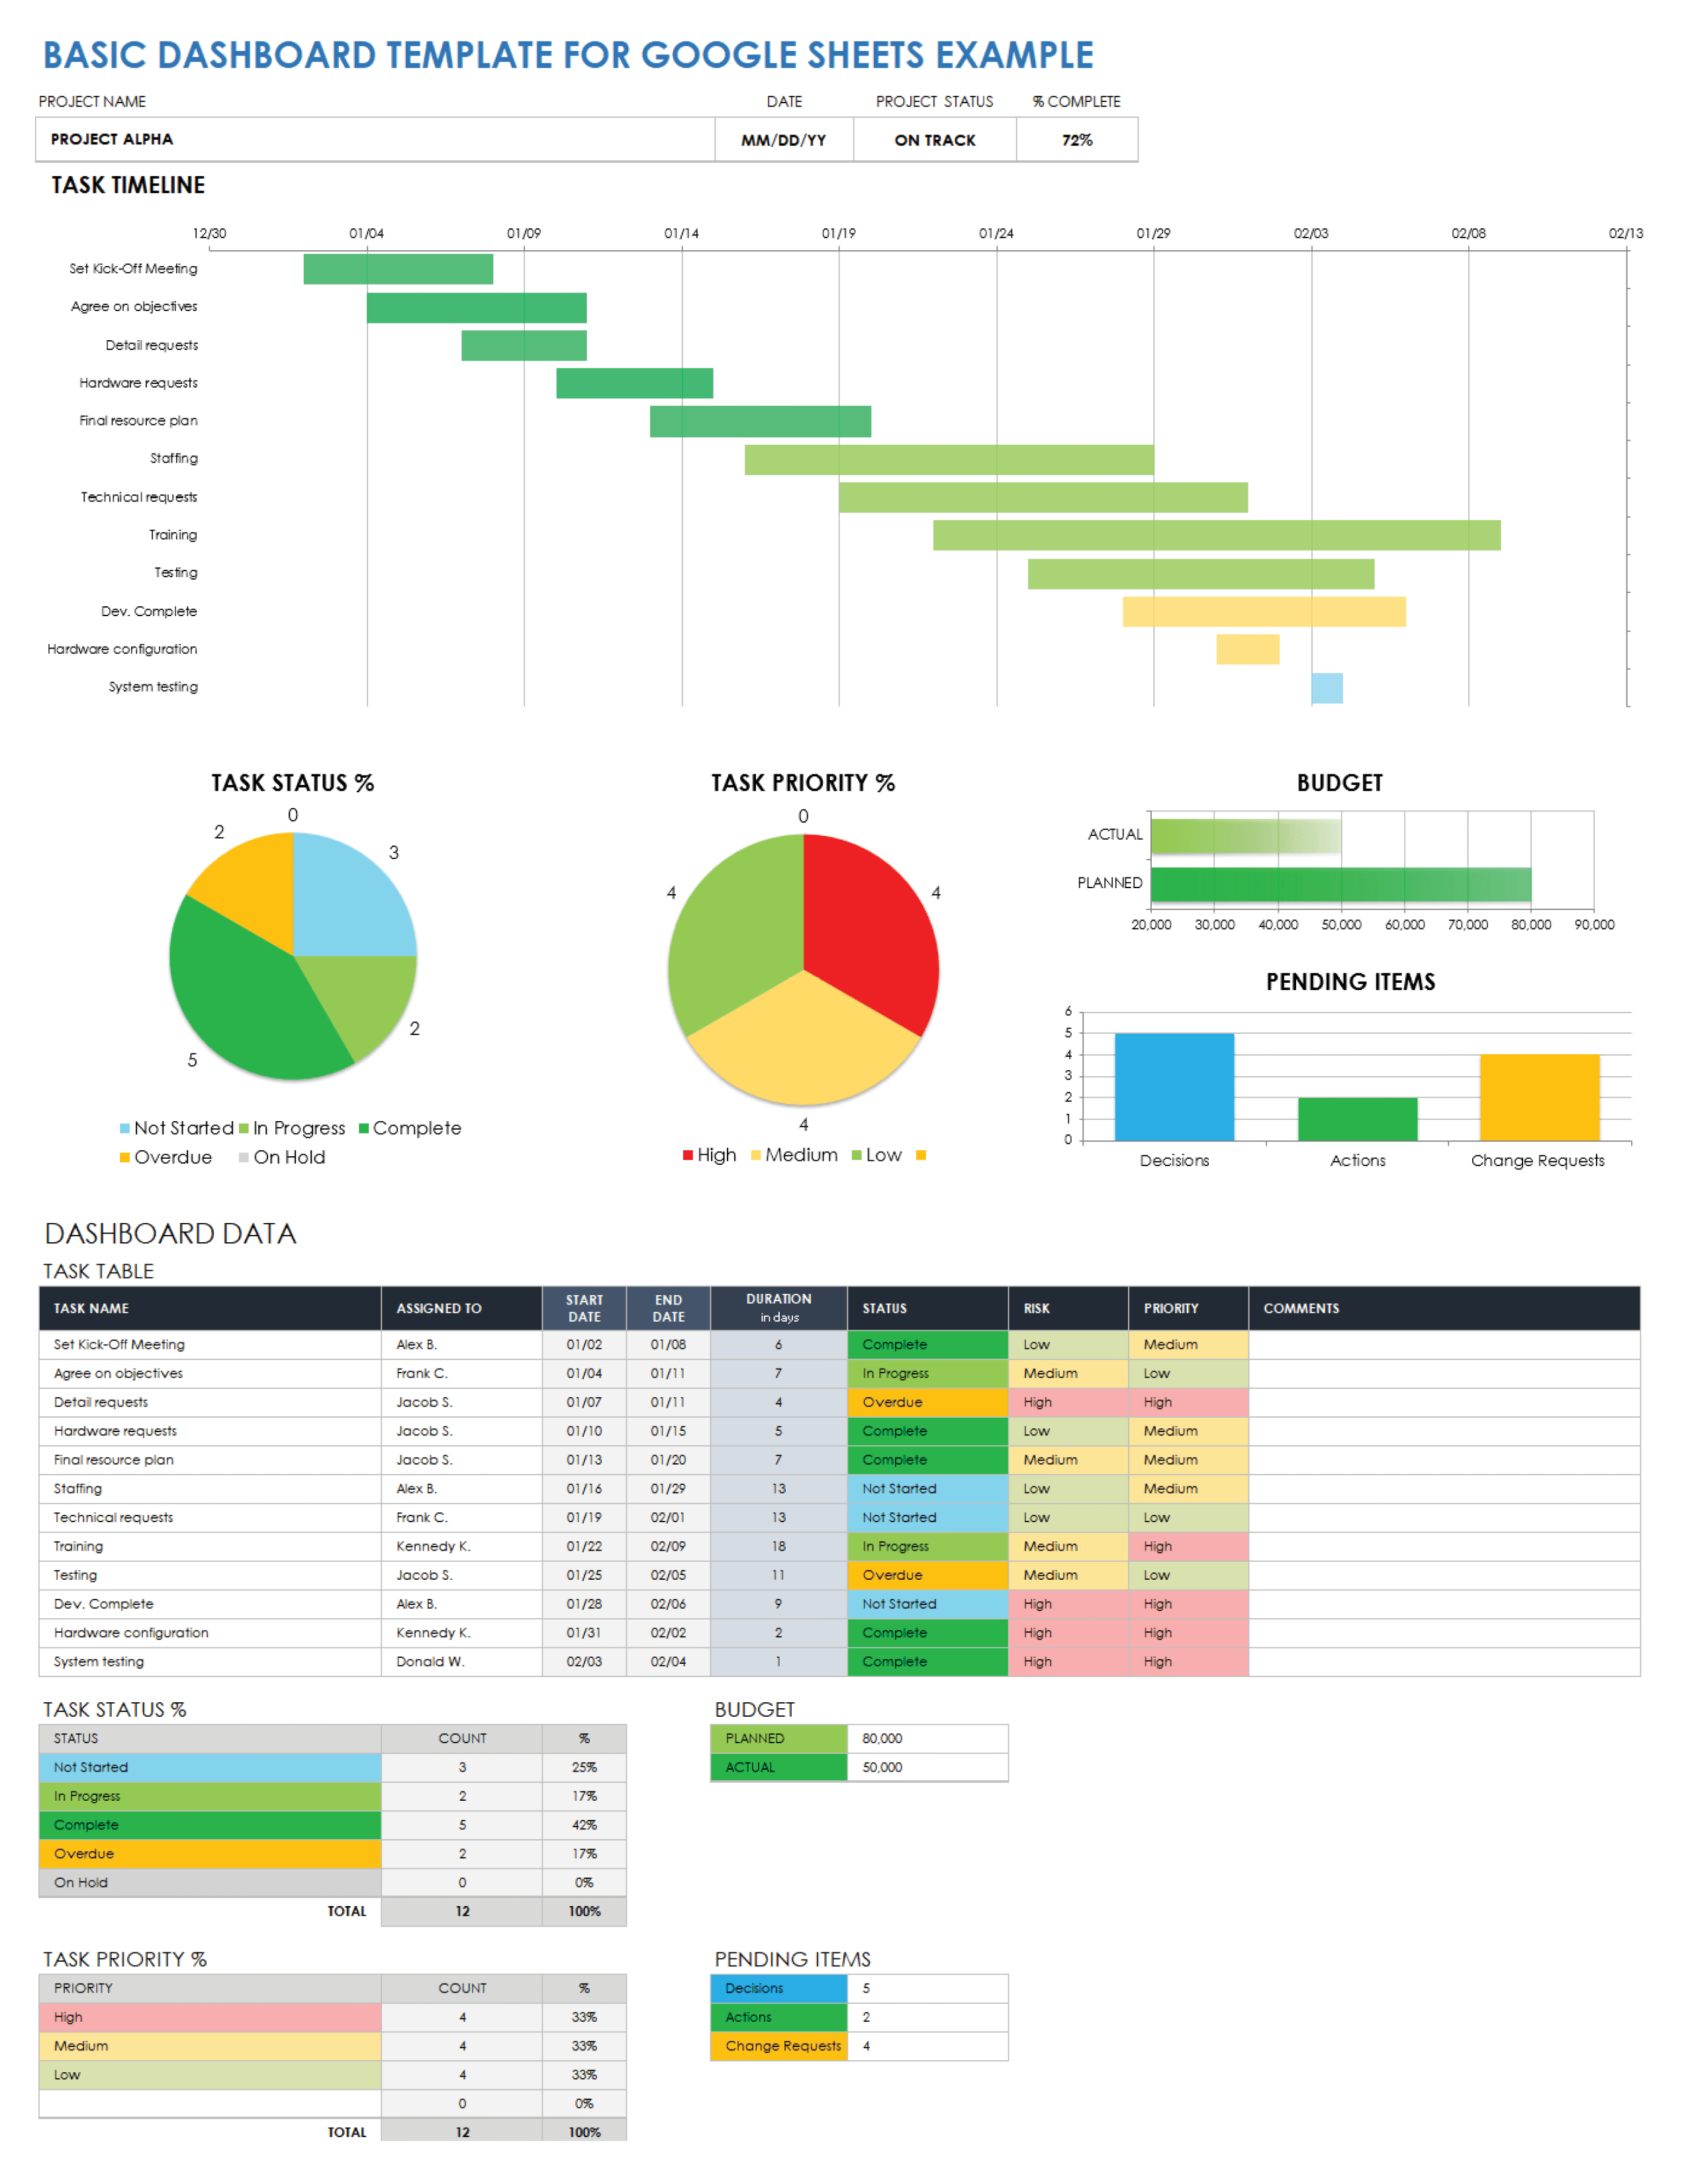
This visually rich, fully customizable dashboard template is perfect for any vertical (e.g., project management, sales, marketing) and is available with example data or as a blank template. Exceed performance expectations with this dynamic, easy-to-use basic dashboard template. The template provides a Gantt chart timeline that you can use to track your project’s tasks, status, and priority in multiple pie charts. At the same time, bar charts let you view your actual vs. planned budget and any pending items.
See this article on Google Sheets project trackers and project-tracking templates to quantifiably measure performance for your specific project.
Project Dashboard Template for Google Sheets
Download the Project Dashboard Template for Google Sheets
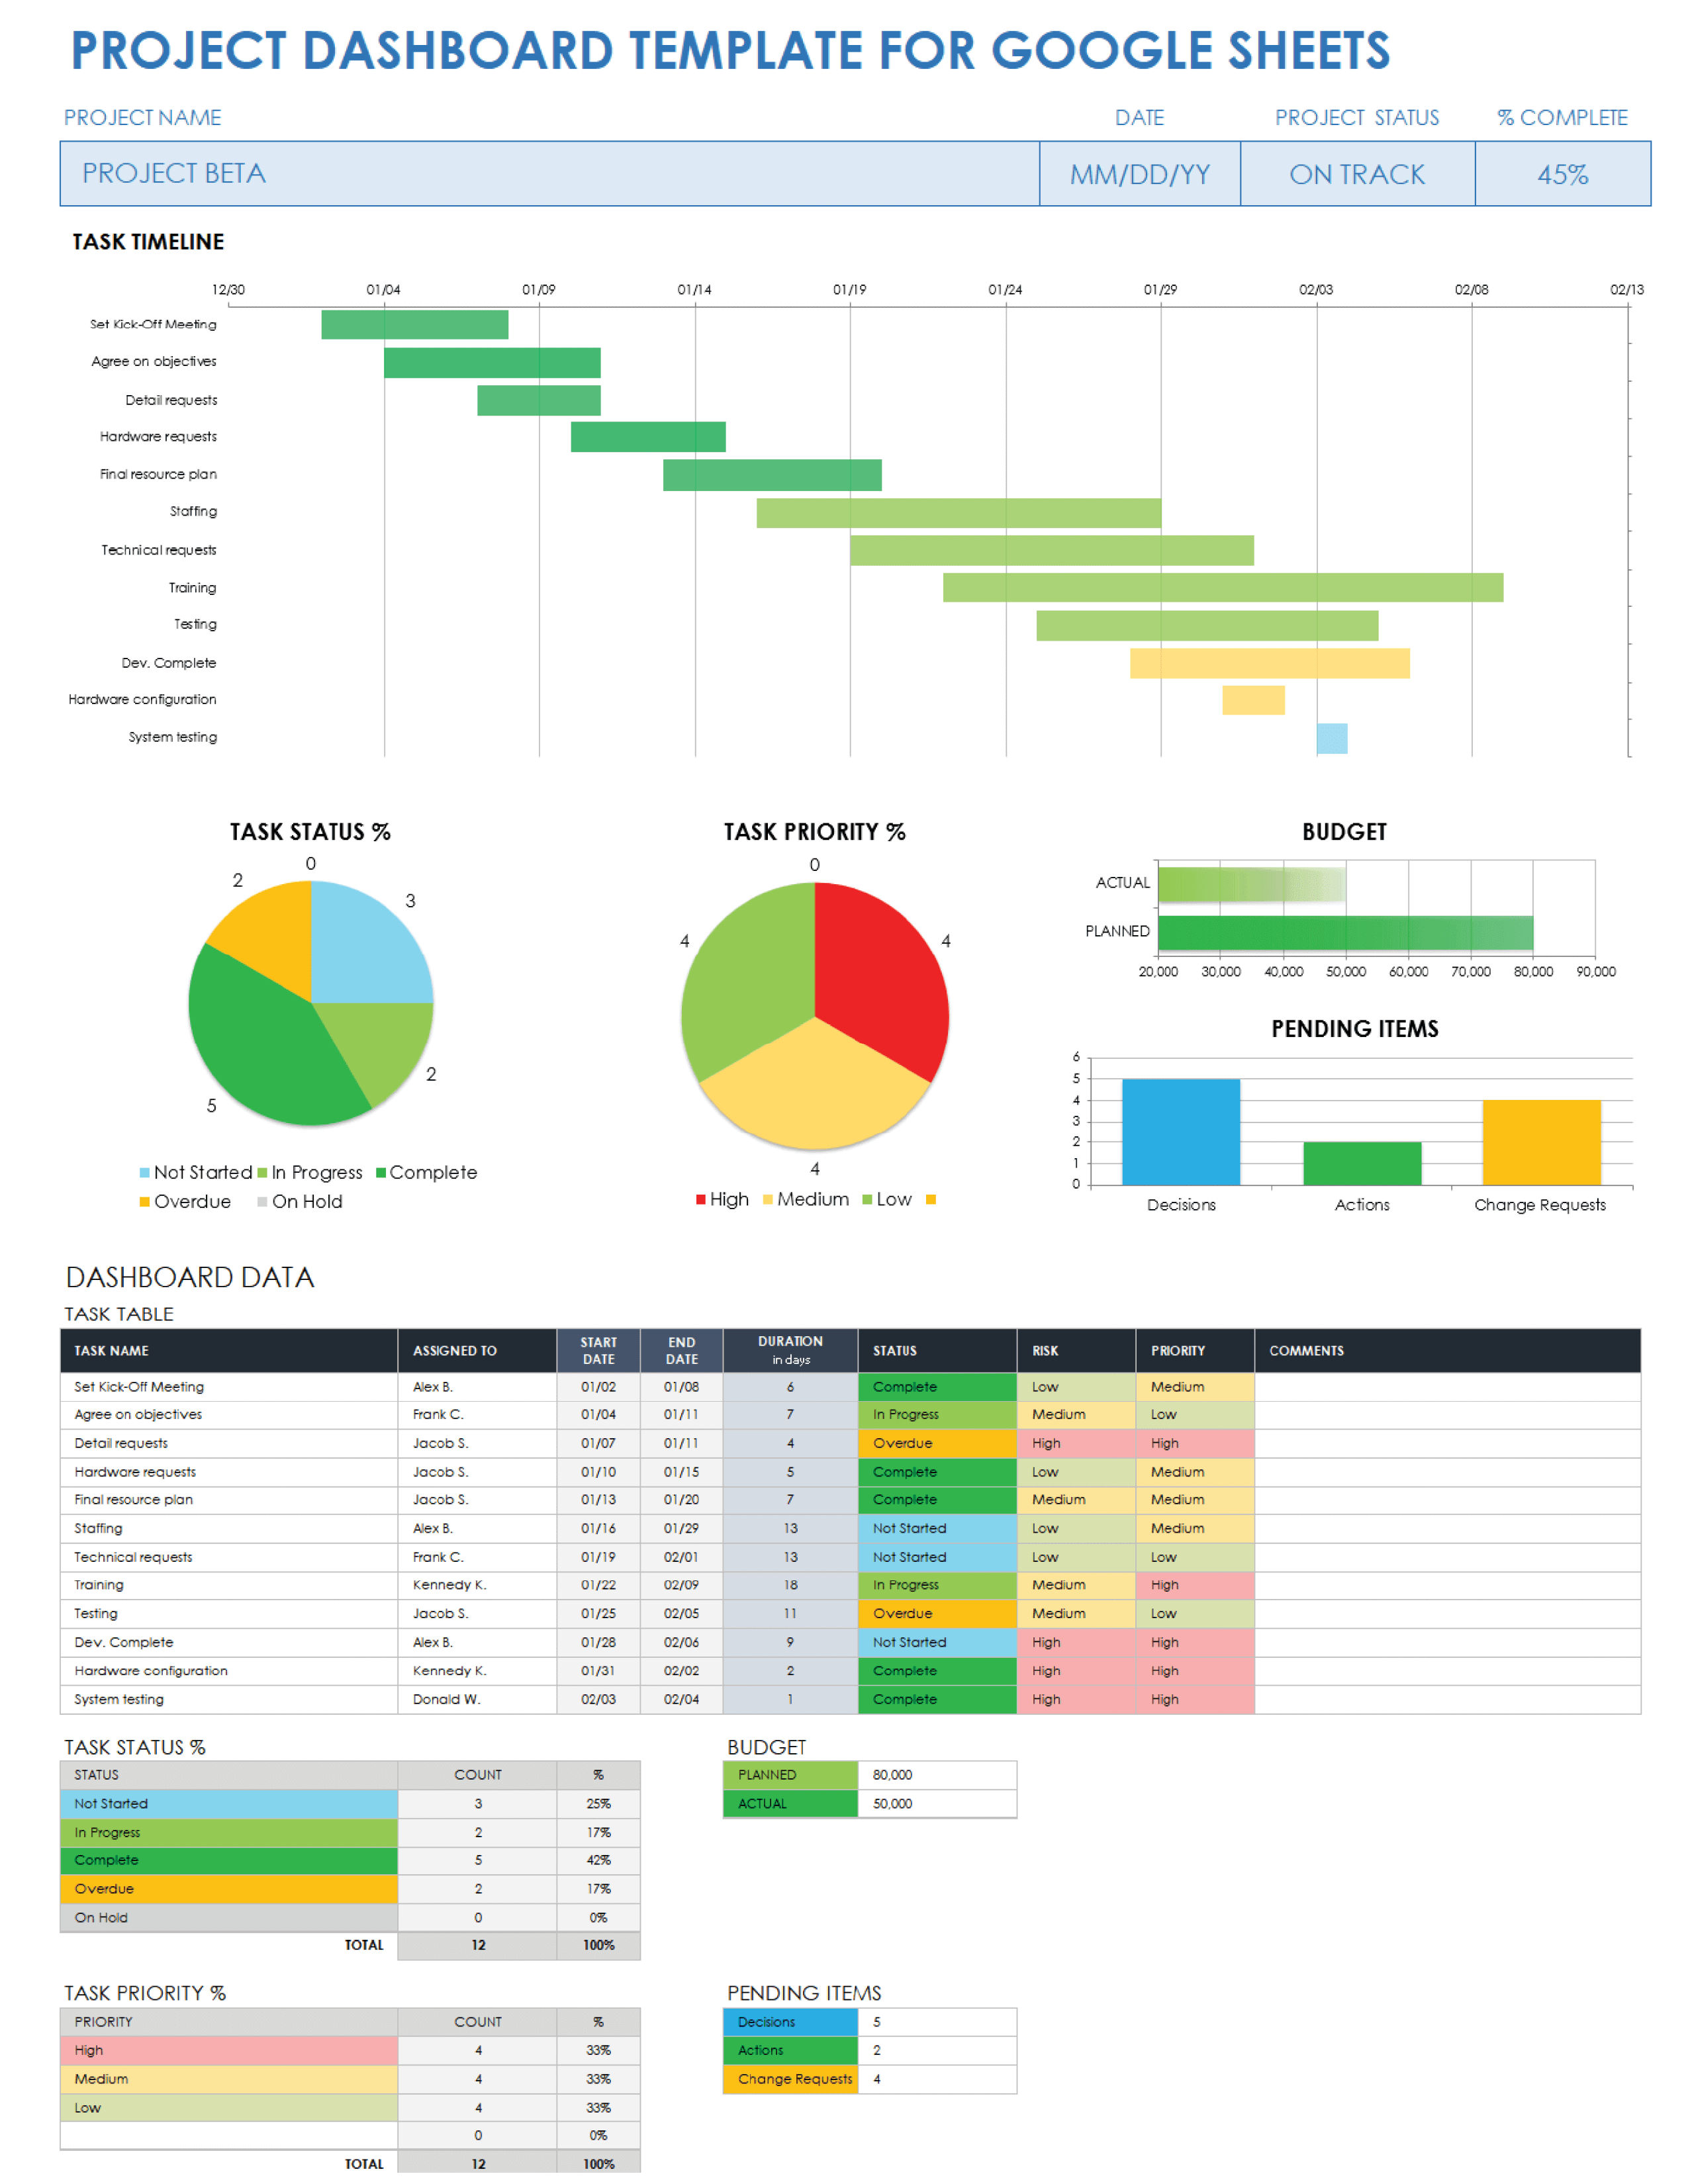
Project managers will find this project dashboard template as a useful tool for launching a project, as well as successfully monitoring and analyzing its progress. Enter due dates and durations of key milestones (e.g., set kickoff meeting, final resource plan, testing phase), create individual tasks, set their priorities, and assign them to team members. This template provides an easy-to-read Overall Task Status pie chart so that you can see at a glance what portion of project tasks are overdue, not started, in progress, or successfully completed.
For more resources on dashboard metrics for project management, see this comprehensive article on Google Sheets project management templates that can provide crucial metrics and deliver valuable insights into the health of your project.
Sales Dashboard Template for Google Sheets
Download the Sales Dashboard Template for Google Sheets
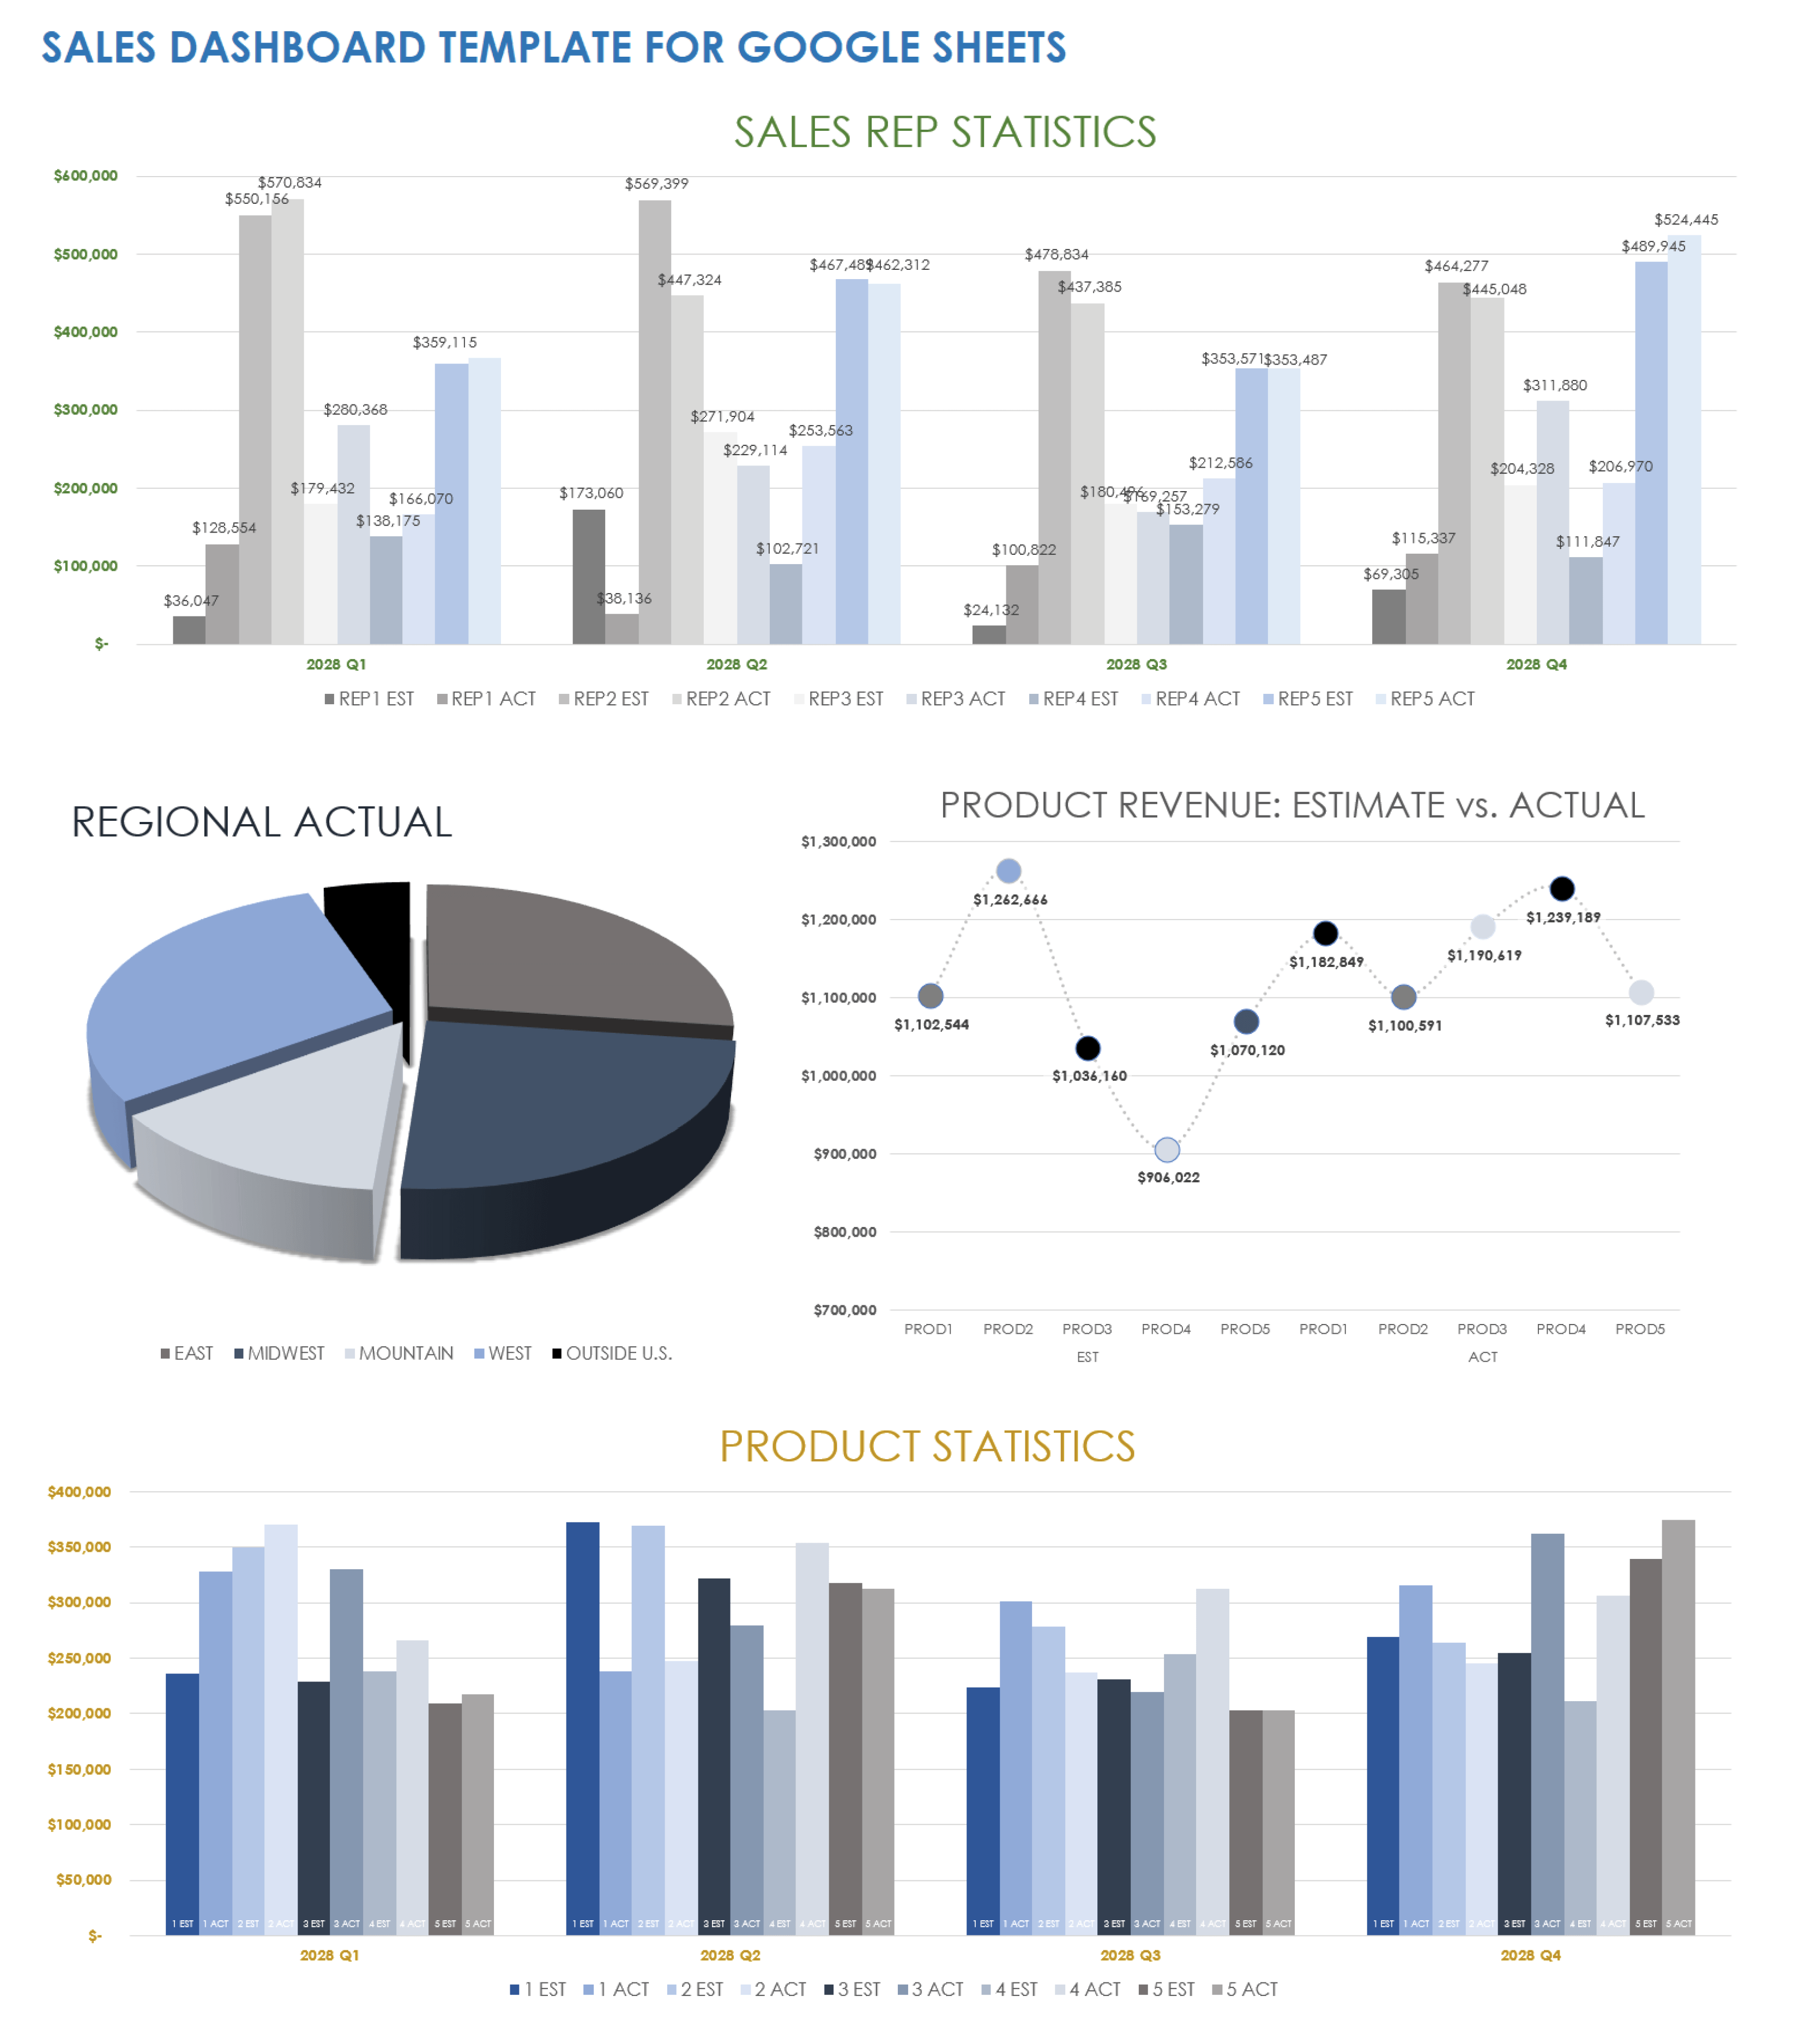
If increasing sales is your primary goal, then this sales dashboard template is your go-to solution. On the template’s Data tab, enter the salesperson, region, product, number of sales, and sales date. The main Sales Management Dashboard tab provides a line graph of where each salesperson is in their ranking. Use the vertical and bar charts to see each salesperson’s regional sales and the overall team’s sales for each project and region.
For additional Smartsheet dashboard resources on various projects, including a sales pipeline dashboard, see this Smartsheet Dashboard Gallery.
KPI Dashboard Template for Google Sheets
Download the KPI Dashboard Template for Google Sheets
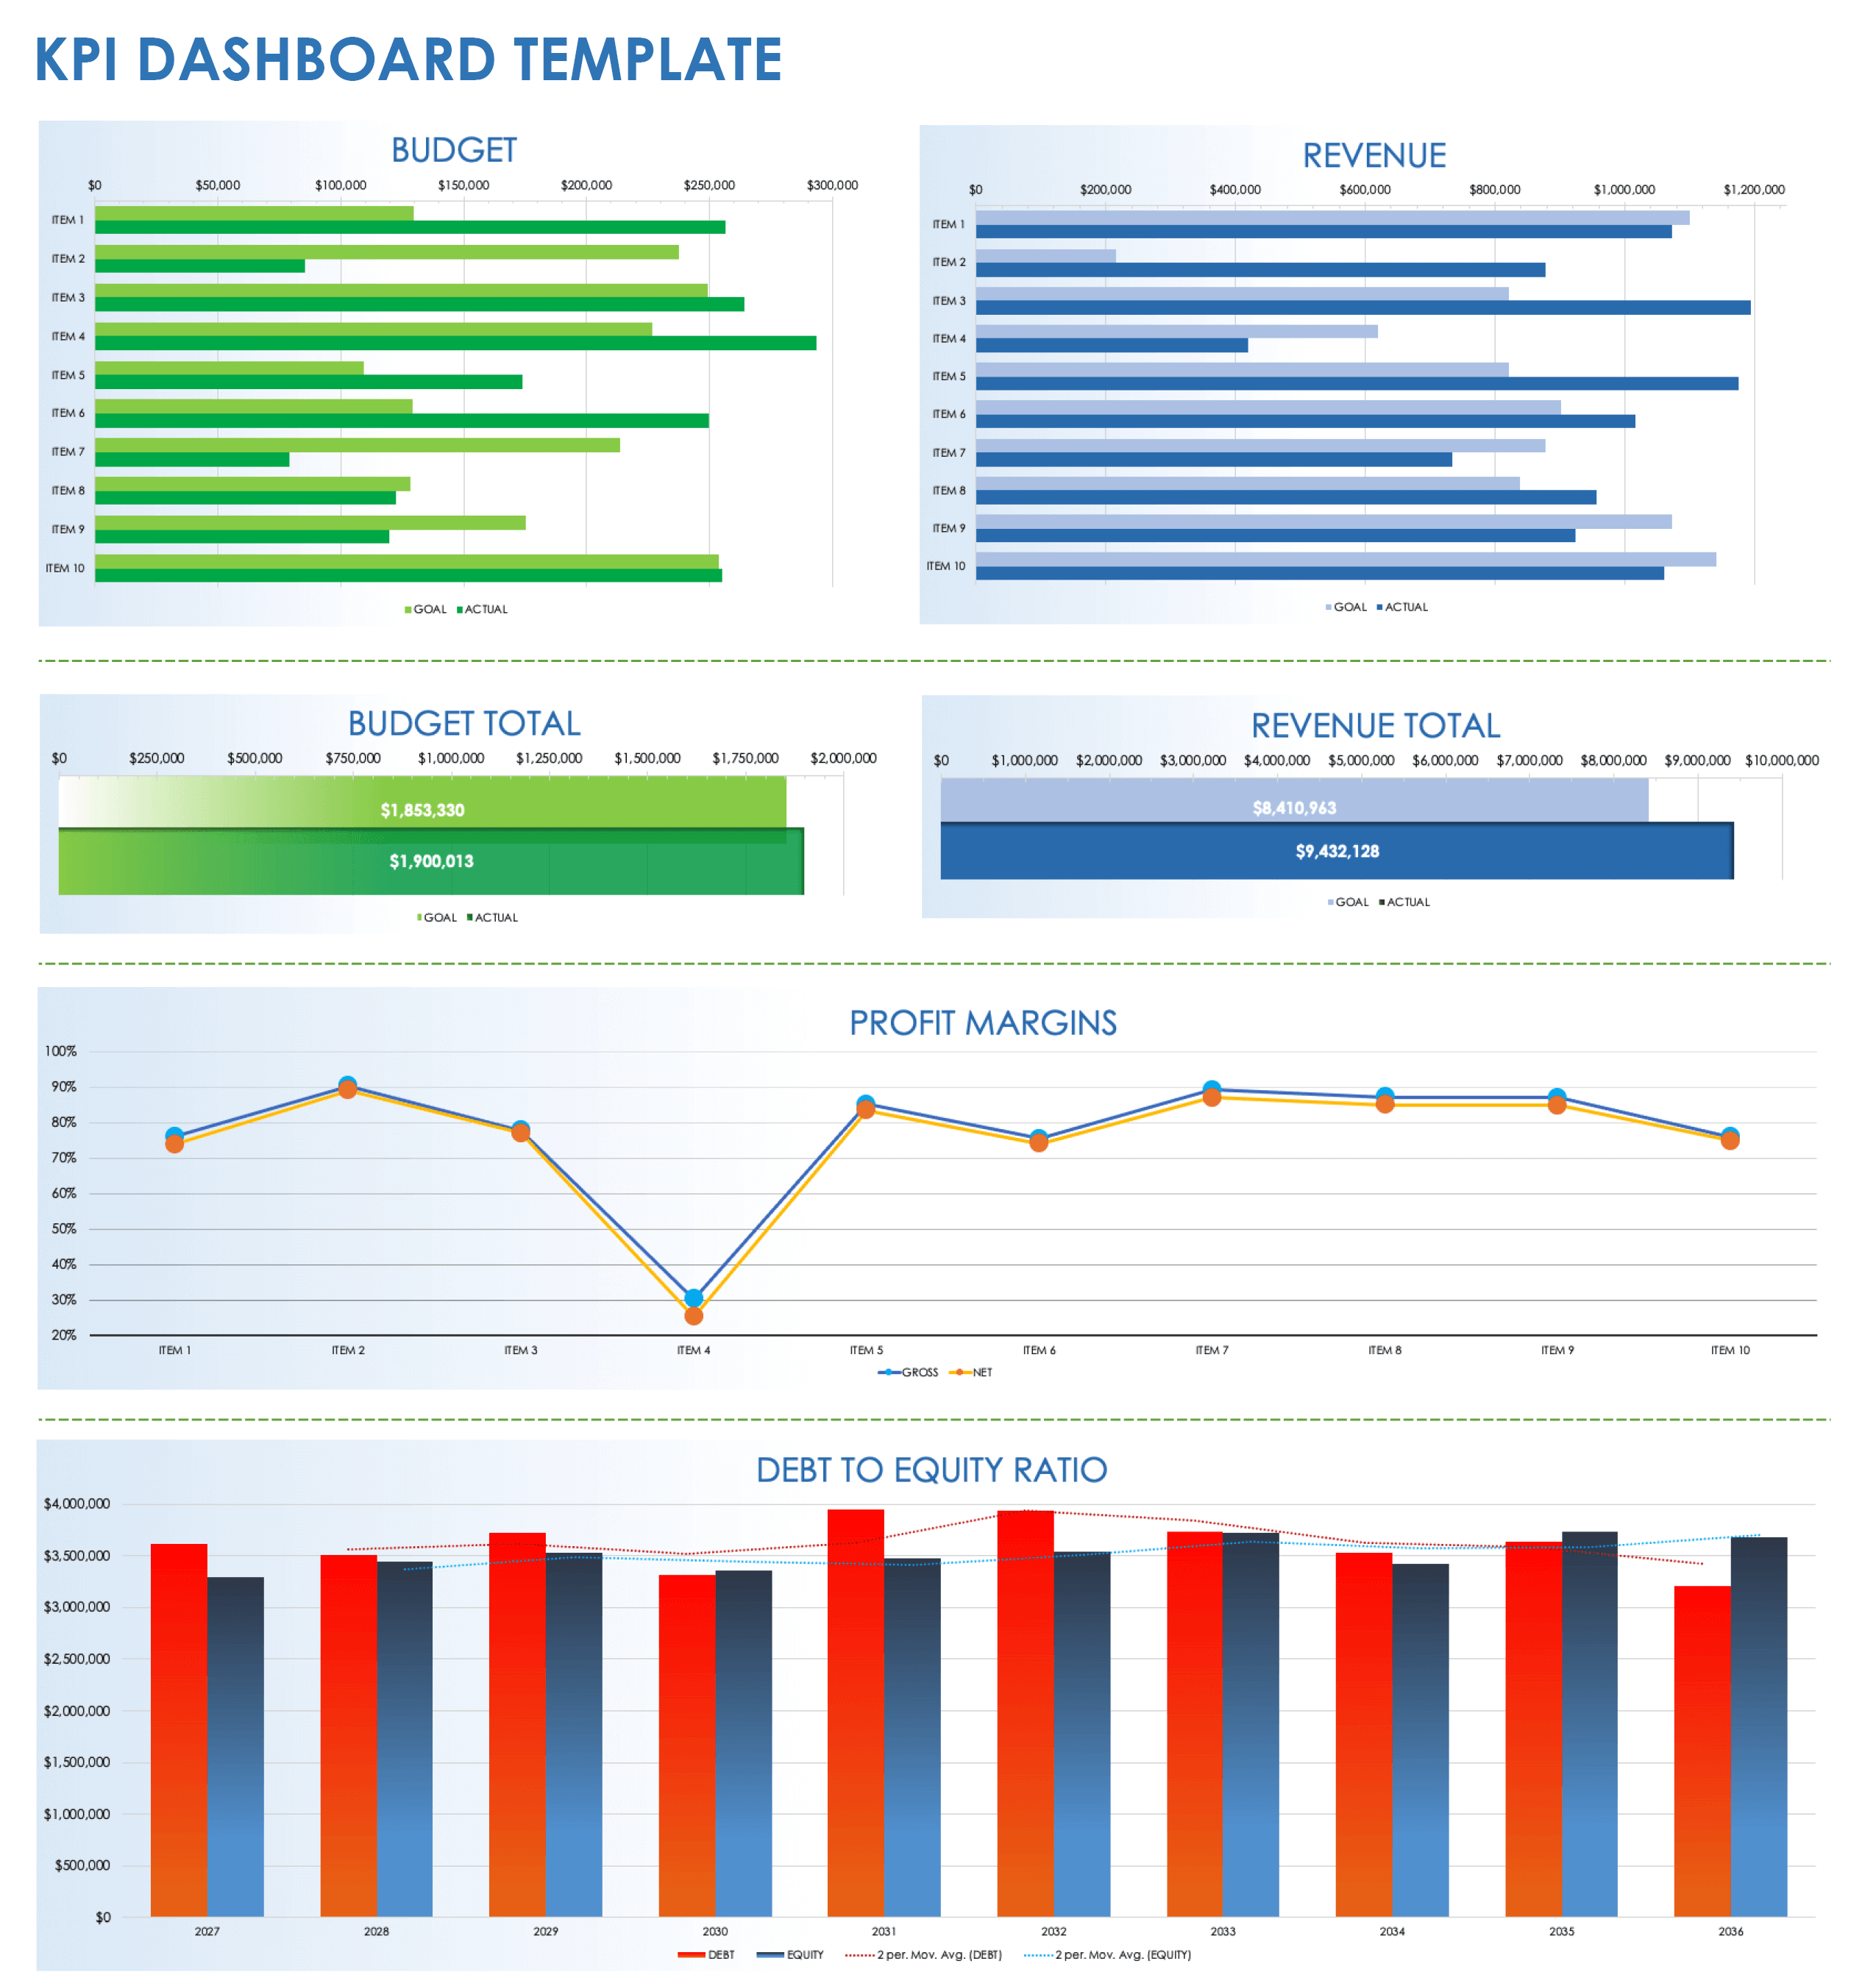
Help team members, project managers, and project sponsors easily understand your key performance indicators (KPIs) with this KPI dashboard template. On the template’s KPI Data tab, enter all of your product, budgetary, net expenses, and other data related to your project and the goals you are trying to achieve. The KPI Dashboard tab then translates this data into Budget and Revenue horizontal bar charts, a Profit Margins line chart, and a Debt to Equity Ratio vertical column chart visualizing your project or organization’s overall fiscal health.
Read this article on KPI dashboards to learn how to review and identify your company’s vital metrics.
Marketing Dashboard Template for Google Sheets
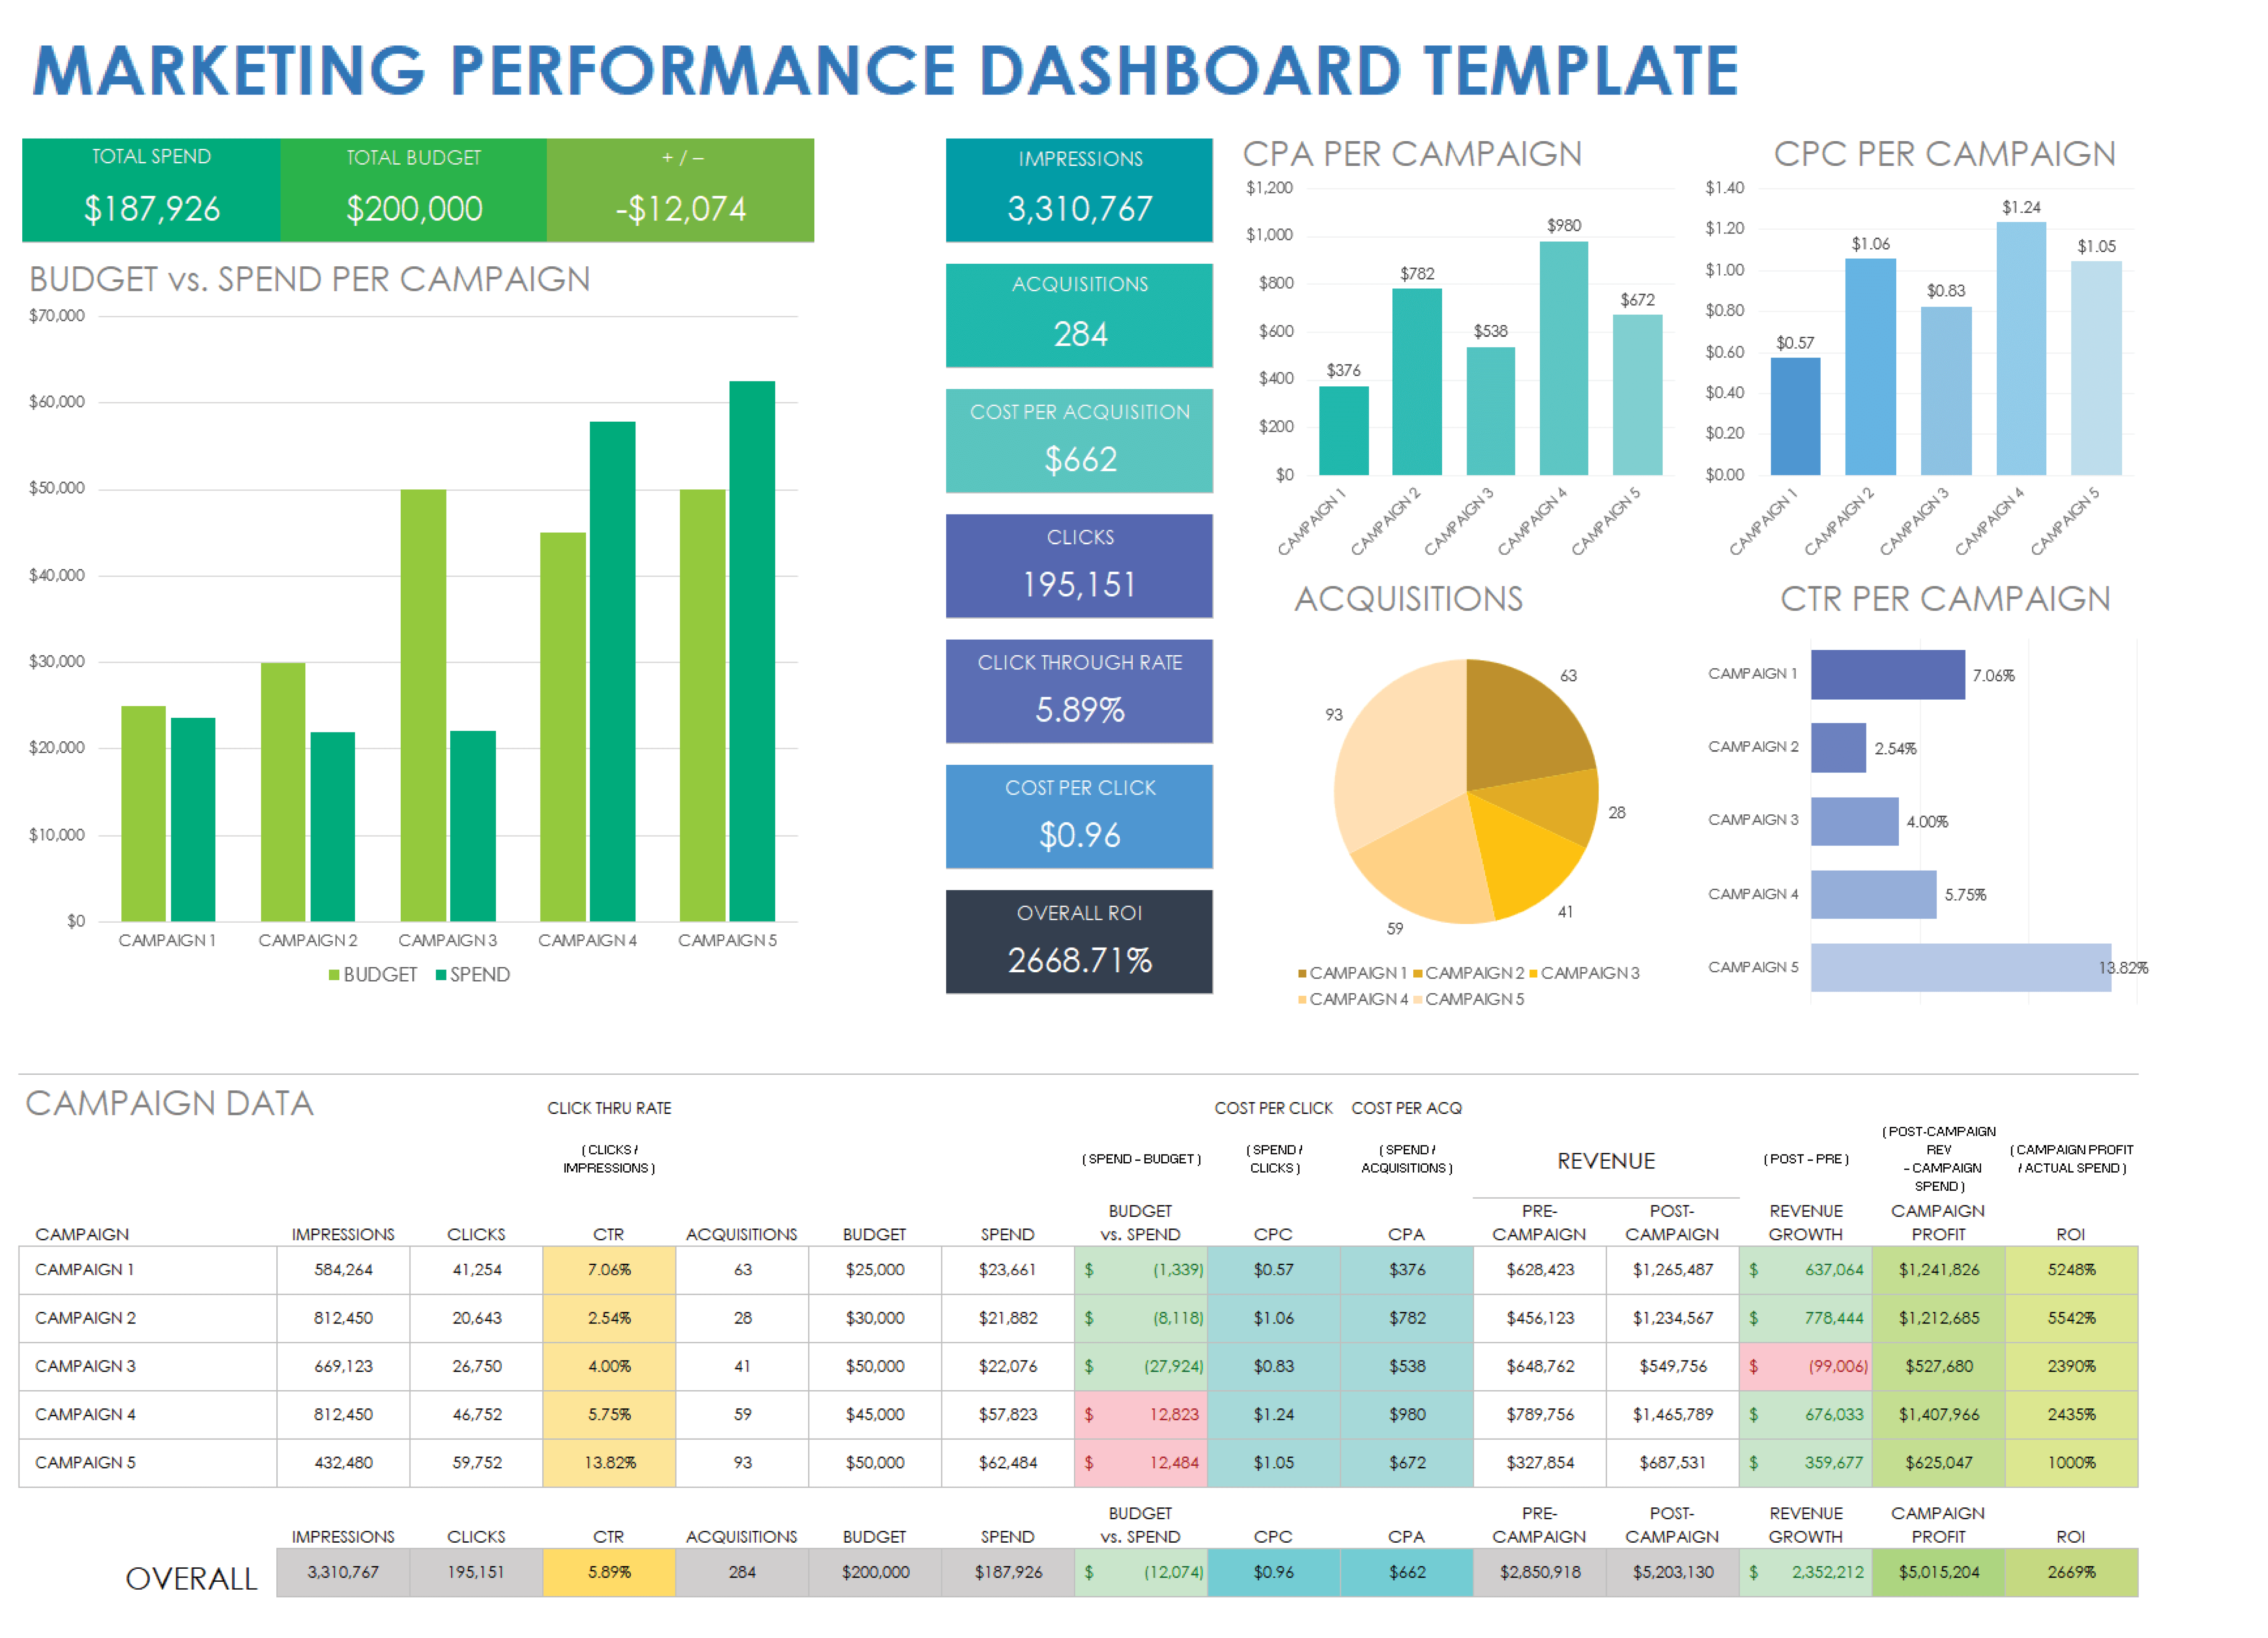
Download the Marketing Performance Dashboard Template for Google Sheets
Keep tabs on your marketing campaign’s key metrics with this distinctive marketing performance dashboard template. The template’s visually dynamic layout enables marketers to track and analyze impressions, acquisitions, cost per acquisition, click-through rate, and overall return on investment (ROI). Use this template to make marketing-specific, data-driven assessments and decisions, and to optimize your marketing strategies to achieve better results.
Social Media Calendar Dashboard Template for Google Sheets
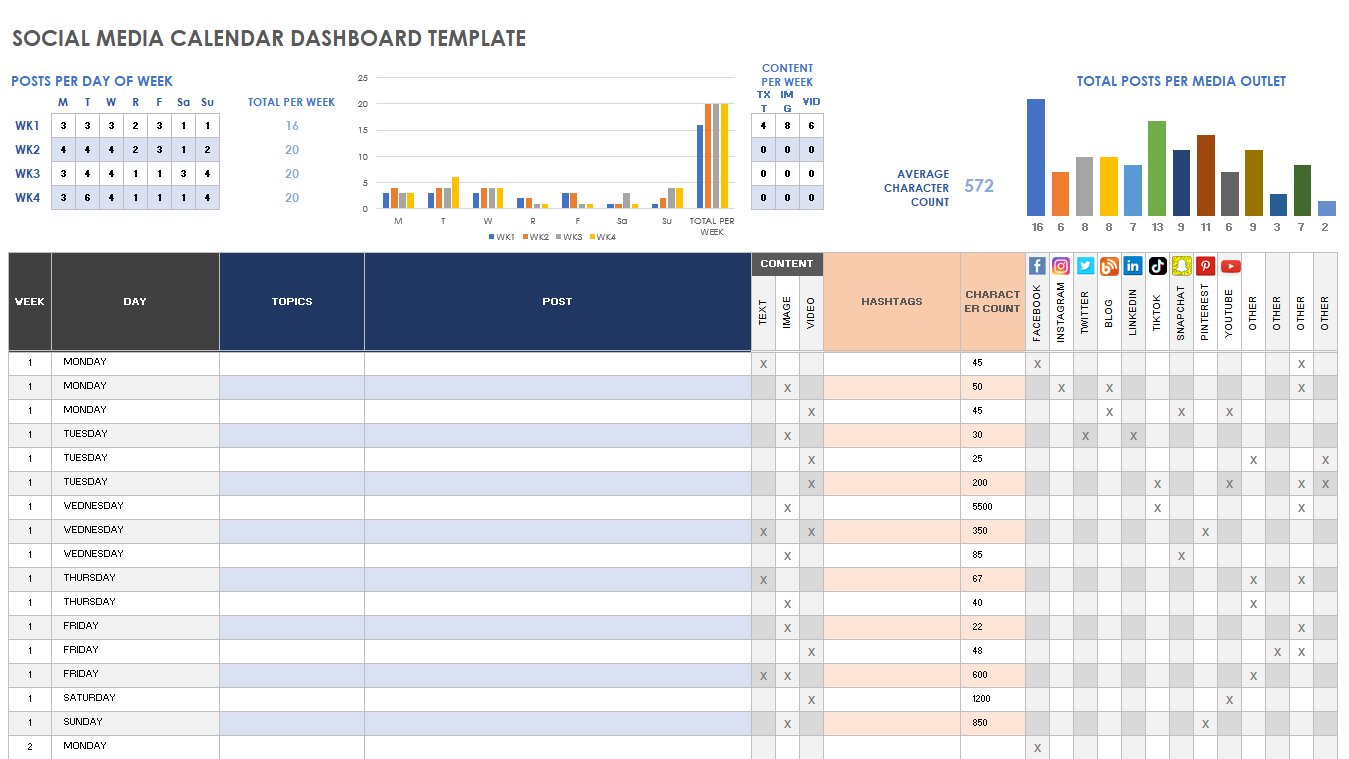
Download the Social Media Calendar Dashboard Template for Google Sheets
This template is the perfect tool for measuring your organization’s social-media marketing campaigns and to get a visual picture of your overall marketing penetration. The template enables you to easily track the success of topics, posts, content type (e.g., text, image, video), hashtags, character count, and which social media platform you use to post content.
See this article on free Google Sheets social media calendar templates to find additional social media tools.
How to Create a Dashboard in Google Sheets
The easiest way to create a dashboard in Google Sheets is to use an existing template. Download a Google Sheets dashboard template from this page and enter your data. Use the dashboard view to track, analyze, and quantify your work.
Follow these step-by-step instructions to create a dashboard in Google Sheets.
1. Download and Add General Project Details to the Basic Dashboard Template in Google Sheets
- Make a copy of the Basic Dashboard Template in Google Sheets and save it to your Google Drive.
- Enter a name for your dashboard in the Project Name field.
- Enter a date for your project in the Date field.
- Enter the project’s status (e.g., On Track) in the Project Status field.
- Enter the percentage of project completion in the % Complete field.
2. Fill in Data for the Task Table
Scroll down to the Dashboard Data section and add your information to the Task Table.
- Enter the name of the task in the Task Name field.
- Enter the name of the person responsible for the task in the Assigned To field.
- Enter a start and end date in the Start Date and End Date fields, respectively.
- Click the drop-down menu in the Status column and click Not Started, In Progress, Complete, Overdue, or On Hold to denote the task’s status.
- Click the drop-down menu in the Risk column and click High, Medium, or Low to denote the task’s level of risk.
- Click the drop-down menu in the Priority column and click High, Medium, or Low to denote the task’s priority level.
- Enter any additional details in the Comments field.
- Enter amounts into the Planned and Actual budget fields.
- Enter the amount of pending items in Decisions, Actions, and Change Requests fields, respectively.
Limitations of Google Sheets Dashboards
While Google Sheets dashboards can work well within Google Workspace, their automation features are few and far between. Whereas dashboards should have easy input and easy-to-read data, Google Sheets dashboards can be time-consuming and labor-intensive.
Gain Real-Time Visibility Into Projects and Programs with Smartsheet Dashboards
From simple task management and project planning to complex resource and portfolio management, Smartsheet helps you improve collaboration and increase work velocity -- empowering you to get more done.
The Smartsheet platform makes it easy to plan, capture, manage, and report on work from anywhere, helping your team be more effective and get more done. Report on key metrics and get real-time visibility into work as it happens with roll-up reports, dashboards, and automated workflows built to keep your team connected and informed.
When teams have clarity into the work getting done, there’s no telling how much more they can accomplish in the same amount of time. Try Smartsheet for free, today.
